Home>Events & Info>Frequency>How To Read A Frequency Response Graph
Frequency
How To Read A Frequency Response Graph
Published: February 18, 2024
Learn how to interpret a frequency response graph and understand the relationship between frequency and amplitude. Discover how to read and analyze frequency data effectively. Gain insights into frequency analysis techniques.
(Many of the links in this article redirect to a specific reviewed product. Your purchase of these products through affiliate links helps to generate commission for AudioLover.com, at no extra cost. Learn more)
Table of Contents
Introduction
Understanding frequency response is crucial in various fields, including audio engineering, electronics, and telecommunications. A frequency response graph provides valuable insights into how a system, device, or component responds to different frequencies. By analyzing this graph, professionals can optimize performance, troubleshoot issues, and make informed decisions to enhance the overall quality of the system.
Frequency response graphs are commonly used in the audio industry to evaluate the performance of speakers, headphones, microphones, and amplifiers. In the field of electronics, these graphs help engineers assess the behavior of filters, amplifiers, and other electronic circuits across a range of frequencies. Additionally, in the realm of telecommunications, frequency response graphs aid in the design and maintenance of communication systems, ensuring that signals are transmitted and received efficiently across various frequencies.
In this article, we will delve into the intricacies of reading and interpreting frequency response graphs. By understanding the components of these graphs and how to decipher them, readers will gain valuable knowledge that can be applied across different disciplines. Whether you're an audio enthusiast, a student studying electronics, or a professional in the telecommunications industry, grasping the fundamentals of frequency response graphs is essential for success in your respective field.
Let's embark on a journey to unravel the mysteries of frequency response graphs and discover how these visual representations of data can unlock a deeper understanding of the behavior of systems and devices across the frequency spectrum.
Understanding Frequency Response
Frequency response refers to the manner in which a system, device, or component reacts to input signals at different frequencies. It provides crucial insights into how the output of the system varies with the frequency of the input signal. In essence, frequency response characterizes the behavior of the system across the entire frequency spectrum, shedding light on its performance and capabilities.
For audio systems, frequency response determines how accurately the system reproduces sound across the audible range. In electronics, frequency response is vital for assessing the performance of amplifiers, filters, and other signal processing components. In telecommunications, frequency response plays a pivotal role in ensuring that signals are transmitted and received with minimal distortion across various frequencies.
Understanding frequency response involves grasping the concept of amplitude and phase response. Amplitude response reflects the system’s gain or attenuation at different frequencies, indicating how the output level changes in relation to the input signal frequency. On the other hand, phase response elucidates the shift in the phase angle between the input and output signals at different frequencies, offering valuable insights into the time delay introduced by the system across the frequency spectrum.
Frequency response is often represented graphically through frequency response plots or graphs, which visually depict the amplitude and phase response of the system over a specified frequency range. By analyzing these graphs, engineers and technicians can gain a comprehensive understanding of how a system or device behaves across different frequencies, enabling them to make informed decisions regarding design, optimization, and troubleshooting.
Ultimately, delving into the intricacies of frequency response empowers professionals to optimize the performance of systems, troubleshoot issues, and ensure the faithful reproduction and transmission of signals across the frequency spectrum. With a solid understanding of frequency response, individuals can harness the power of this fundamental concept to drive innovation and excellence in their respective fields.
Components of a Frequency Response Graph
A frequency response graph typically comprises several key components that collectively convey vital information about the behavior of a system or device across the frequency spectrum. Understanding these components is essential for interpreting the graph and extracting actionable insights. Let’s explore the fundamental elements of a frequency response graph:
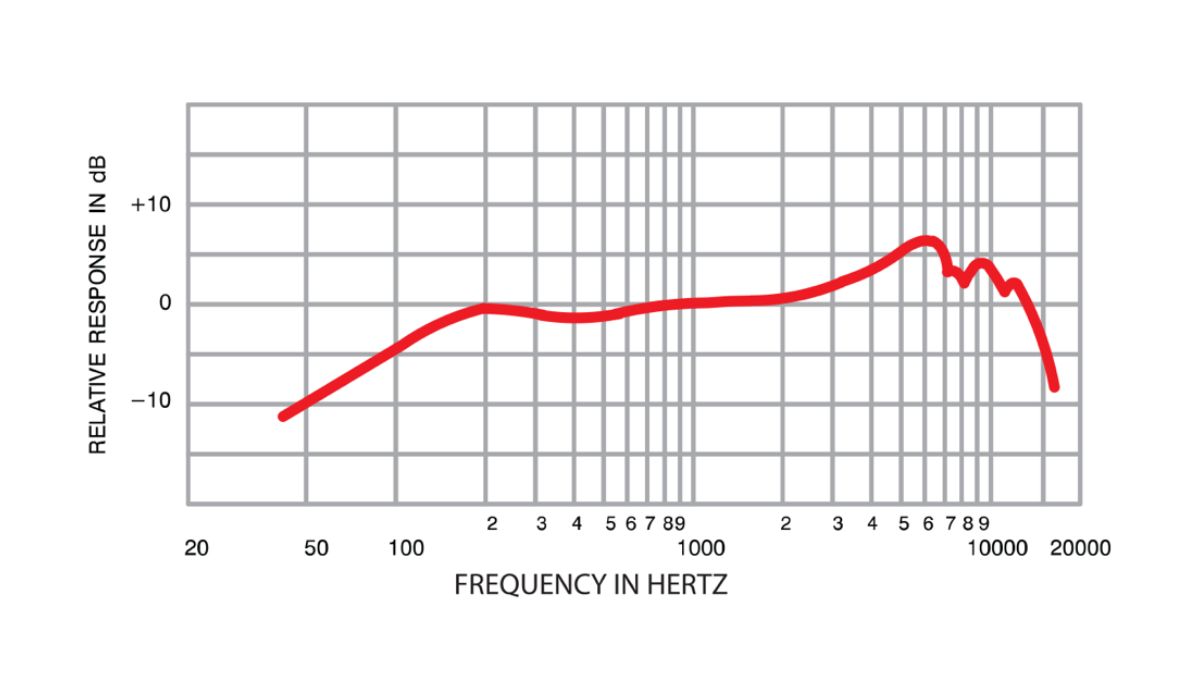
- Frequency Axis: The horizontal axis of the graph represents the frequency in hertz (Hz). It spans the entire frequency range of interest and is divided into increments that allow for precise analysis of the system’s response at different frequencies.
- Amplitude Axis: The vertical axis of the graph denotes the amplitude response of the system, typically measured in decibels (dB). It illustrates how the system’s gain or attenuation varies with frequency, providing crucial insights into the system’s frequency-dependent behavior.
- Phase Axis: In some frequency response graphs, the phase response is depicted on a secondary vertical axis, showcasing the phase shift introduced by the system at different frequencies. This component offers valuable information about the time delay experienced by the input signal as it passes through the system.
- Gain Plot: The gain plot, also known as the amplitude response plot, illustrates how the magnitude of the output signal changes concerning the input signal across the frequency spectrum. It provides a visual representation of the system’s gain or attenuation at different frequencies, offering critical insights into its frequency-dependent behavior.
- Phase Plot: When the phase response is included in the graph, the phase plot showcases the phase shift introduced by the system at various frequencies. This component is instrumental in understanding the time delay experienced by signals as they traverse the system, impacting the overall signal integrity.
By comprehending these components and their significance within the frequency response graph, engineers, technicians, and researchers can effectively analyze the behavior of systems and devices across the frequency spectrum. This understanding serves as a cornerstone for making informed decisions regarding system design, optimization, and troubleshooting, ultimately contributing to the advancement of various technological fields.
Reading a Frequency Response Graph
Reading a frequency response graph involves analyzing the plotted data to extract valuable insights into the behavior of a system or device across the frequency spectrum. By deciphering the information presented in the graph, professionals can gain a deeper understanding of how the system responds to input signals at different frequencies. Here’s a step-by-step guide to effectively read a frequency response graph:
- Identify Frequency Range: Begin by examining the frequency axis to determine the range of frequencies covered by the graph. Note the lowest and highest frequencies depicted, as well as the frequency increments or divisions along the axis.
- Analyze Amplitude Response: Focus on the gain plot, which illustrates the amplitude response of the system. Identify any peaks, dips, or fluctuations in the amplitude curve, as these indicate frequency-dependent variations in the system’s gain or attenuation.
- Interpret Phase Response (if available): If the graph includes a phase plot, pay attention to the phase response at different frequencies. Note any abrupt phase shifts or gradual changes, as these insights can reveal the system’s time delay characteristics across the frequency spectrum.
- Assess Gain and Phase Margin: For stability analysis in control systems, engineers often examine the gain and phase margins from the frequency response graph. These margins provide critical information about the system’s stability and robustness in the face of disturbances and variations in operating conditions.
- Identify Cutoff Frequencies (if applicable): In the context of filters and signal processing systems, frequency response graphs can indicate the cutoff frequencies where the system’s behavior transitions significantly. Identifying these cutoff frequencies is essential for designing and optimizing filter circuits and signal processing algorithms.
By following these steps and carefully examining the plotted data, professionals can glean valuable insights into the frequency-dependent behavior of systems and devices. This information serves as a foundation for making informed decisions regarding system design, optimization, and performance enhancement across a broad spectrum of technological applications.
Interpreting Frequency Response Data
Interpreting frequency response data entails extracting meaningful insights from the graph to understand the behavior of a system or device across the frequency spectrum. By analyzing the plotted data, professionals can derive valuable information that influences design decisions, performance optimization, and troubleshooting strategies. Here are key aspects to consider when interpreting frequency response data:
- Frequency Range Analysis: Assess the system’s response across the entire frequency range depicted in the graph. Identify any specific frequency bands where the system exhibits notable gain, attenuation, or phase characteristics, as these insights can inform targeted adjustments and optimizations.
- Peak and Dip Identification: Locate peaks and dips in the amplitude response plot, as they signify resonant frequencies, bandwidth limitations, or frequency-dependent anomalies within the system. Understanding these features is crucial for addressing resonance issues and optimizing frequency response for enhanced performance.
- Phase Shift Analysis: If the graph includes a phase response plot, analyze the phase shift at different frequencies. Significant phase shifts can impact signal integrity and timing, influencing the overall performance of the system. Understanding these phase characteristics is essential for mitigating time delay issues and ensuring accurate signal transmission and processing.
- Stability Assessment: In the realm of control systems, frequency response data is utilized to evaluate stability. Engineers examine gain and phase margins to assess the system’s robustness and response to disturbances. Interpreting these stability indicators is crucial for ensuring reliable and predictable system behavior in dynamic operational environments.
- Filter Characteristics (if applicable): For filter circuits and signal processing systems, frequency response data reveals crucial information about cutoff frequencies, passband ripple, stopband attenuation, and transition band behavior. Interpreting these characteristics is essential for designing and optimizing filters to meet specific frequency domain requirements.
By delving into the intricacies of frequency response data and extracting actionable insights, professionals can make informed decisions to optimize system performance, troubleshoot issues, and drive innovation in diverse technological domains. Interpreting the nuances of frequency response data empowers individuals to leverage this valuable information for the advancement of audio systems, electronic circuits, telecommunications networks, and control systems, among other applications.
Practical Applications of Frequency Response Graphs
Frequency response graphs find widespread application across various industries and disciplines, serving as invaluable tools for system analysis, design optimization, and performance evaluation. The insights derived from these graphs have practical implications that extend to diverse technological domains. Here are some key practical applications of frequency response graphs:
- Audio Engineering: In the realm of audio systems, frequency response graphs are utilized to assess the performance of speakers, headphones, microphones, and amplifiers. Engineers and audio enthusiasts rely on these graphs to evaluate frequency response characteristics, identify resonant frequencies, and optimize system design for faithful sound reproduction across the audible range.
- Electronics Design and Testing: Frequency response graphs play a pivotal role in electronics design, aiding engineers in evaluating the behavior of amplifiers, filters, and signal processing circuits. These graphs provide critical insights into gain, attenuation, bandwidth, and phase characteristics, guiding the optimization of electronic systems for enhanced performance and reliability.
- Telecommunications: Frequency response graphs are essential for analyzing the behavior of communication systems, ensuring efficient signal transmission and reception across diverse frequencies. Telecom professionals leverage these graphs to evaluate the frequency-dependent characteristics of transmission lines, antennas, and signal processing components, facilitating the design and maintenance of robust communication networks.
- Control Systems Analysis: In the domain of control engineering, frequency response graphs are employed to assess the stability and performance of feedback control systems. Engineers use these graphs to analyze gain and phase margins, identify resonant frequencies, and optimize controller design for robust and predictable system behavior in dynamic operational environments.
- Filter Design and Optimization: For filter circuits and signal processing applications, frequency response graphs are instrumental in characterizing filter behavior, identifying cutoff frequencies, assessing passband ripple, and optimizing stopband attenuation. Engineers rely on these graphs to design and fine-tune filters for specific frequency domain requirements in audio, telecommunications, and instrumentation systems.
By leveraging frequency response graphs, professionals across diverse industries can make informed decisions regarding system design, optimization, and troubleshooting. These practical applications underscore the significance of frequency response analysis in driving innovation and excellence across audio, electronic, telecommunications, control, and signal processing domains, ultimately shaping the advancement of technology and enhancing the user experience in various applications.
Conclusion
Frequency response graphs serve as powerful tools for gaining insights into the behavior of systems and devices across the frequency spectrum, with practical applications spanning audio engineering, electronics, telecommunications, control systems, and signal processing. By understanding the components of these graphs and learning how to read and interpret them, professionals can unlock a deeper understanding of system performance, enabling them to make informed decisions that drive innovation and excellence in their respective fields.
From evaluating the fidelity of audio reproduction to optimizing the performance of electronic circuits, frequency response graphs provide a visual representation of amplitude and phase characteristics, shedding light on the frequency-dependent behavior of systems. These insights are instrumental in identifying resonant frequencies, assessing stability, and designing filters and control systems that meet specific frequency domain requirements.
As technology continues to advance, the role of frequency response analysis becomes increasingly critical in ensuring the reliability, performance, and user experience of various systems and devices. From refining the sound quality of audio systems to enhancing the efficiency of communication networks, the practical applications of frequency response graphs underscore their significance in shaping the technological landscape.
In conclusion, a comprehensive understanding of frequency response graphs empowers professionals to optimize system performance, troubleshoot issues, and drive innovation across diverse technological domains. By harnessing the insights derived from these graphs, individuals can elevate the quality and reliability of audio systems, electronic circuits, telecommunications networks, and control systems, ultimately contributing to the advancement of technology and the seamless integration of frequency-dependent characteristics into everyday applications.